1,000-Spin CAD Variance & Drawdown Oscilloscope
Compare how identical starting bankrolls and identical Return to Player percentages diverge radically across 1,000 spins under Low (1/6–2/6), High (4/6–5/6), and Extreme (6/6) volatility regimes. Measure real-time Risk of Ruin (%) and average peak-to-trough CAD drawdown.
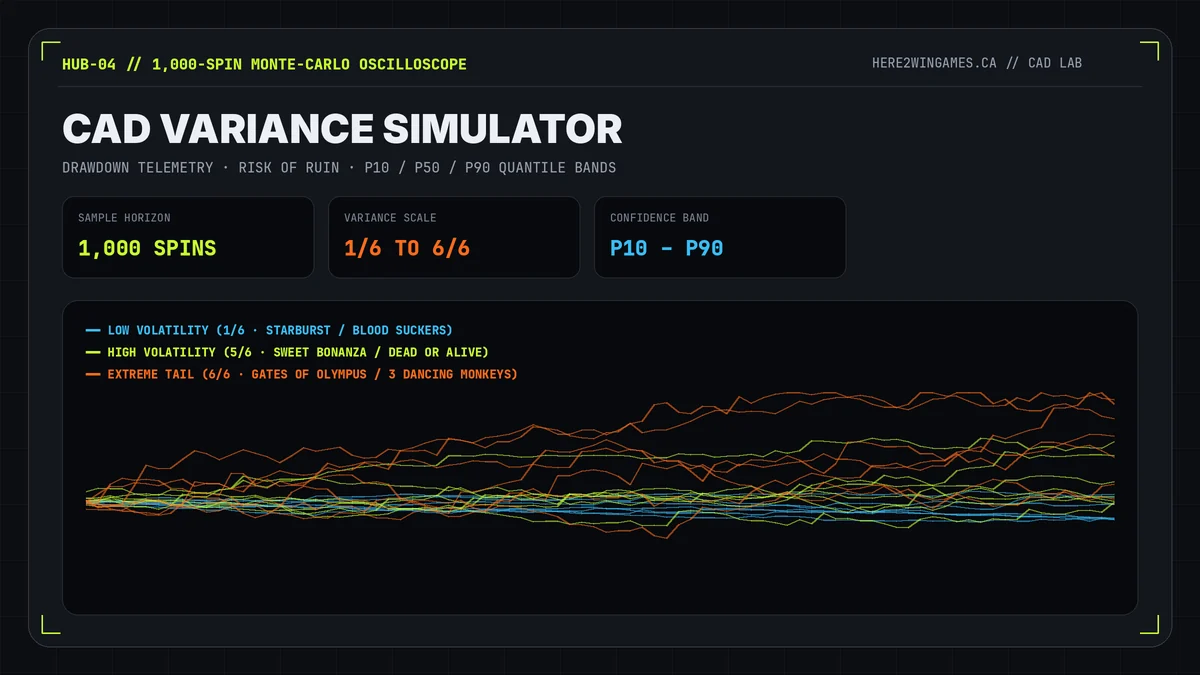
Overlay Low, High & Extreme Dispersion Cones
Matching Spin Multiples to Catalog Volatility Tiers
Why do so many Canadian sessions bust before hitting a single Free Spins feature? When a player brings a C$100 deposit to Here2Win casino and stakes C$2.00 per spin (only 50 base bets of depth) on a 6/6 extreme-dispersion game like Gates of Olympus 96.50% tumble telemetry, standard deviation overwhelms the bankroll long before the 1-in-200+ bonus cycle can materialize.
Quantitative bankroll management calibrates spin stakes by bet-multiples of starting equity:
- Low Volatility (1/6–2/6): 100x to 150x bet depth (e.g., C$1.00 spins on C$120) suffices on smooth titles such as Starburst 96.09% Win-Both-Ways or Aloha! Cluster Pays 96.42%.
- Medium-High Volatility (4/6–5/6): 200x to 300x bet depth (e.g., C$0.50 spins on C$125) absorbs 80-spin dry spells on Sweet Bonanza 96.48% or Wolf Gold.
- Extreme Volatility (6/6): 350x to 500x bet depth (e.g., C$0.20–C$0.40 spins on C$150) is essential to survive tail droughts without hitting the C$0 floor.
Combine these sizing rules with our interactive CAD bonus wagering calculator when planning x35 or x30 rollovers, and review how we generate log-normal bonus spikes in the Monte-Carlo simulation methodology.
Peak-to-Trough Drawdown Math & Quantile Recovery Horizons
In stochastic telemetry, Maximum Drawdown (MDD) measures the deepest vertical drop from a session's highest CAD balance peak down to its subsequent trough before a new high is reached. On a 1/6 slot with σ ≈ 2.5, 1,000 spins at C$1.00 rarely experience a peak-to-trough drop worse than C$45 to C$65 because 20%–44% hit frequencies continually replenish the balance with 1x–8x line connections.
On a 5/6 or 6/6 tumble or sticky-wild engine, however, up to 35% of the entire Return to Player resides inside bonus rounds triggered roughly once every 180 to 260 spins. Missing two consecutive expected bonus cycles easily produces a 120x–180x bet drawdown—meaning an under-bankrolled player hits the absorbing C$0 bust floor before the upper-quantile P90 multiplier spike can ever arrive. Keeping bet sizes aligned to the 350x–500x rule preserves statistical runway across the full 1,000-spin horizon.
Safe Denomination Matrix for C$150 Balance
Target maximum spin stake to hold 1,000-spin Risk of Ruin below 20% at ~96.2% RTP:
- 1/6 Volatility: C$1.00 – C$1.25 / spin
- 2/6 Volatility: C$0.75 – C$1.00 / spin
- 4/6 Volatility: C$0.50 – C$0.75 / spin
- 5/6 Volatility: C$0.30 – C$0.50 / spin
- 6/6 Volatility: C$0.20 – C$0.30 / spin